Friday, January 28, 2022

ProtoBuf - VS 2022 - Support

Copied from https://mahmud.blog/2019/07/17/use-visual-studio-to-generate-cs-from-proto-and-steamline-your-development-process/


Use Visual Studio to generate .cs from .proto and steamline your development process

Well, protobuf. Right? If you haven’t heard of it, please visit – https://developers.google.com/protocol-buffers/ and read it. It is pretty cool in terms network communication. Reduces size of your payload a lot.

Now, if you are like me trying to use .proto files with Visual Studio, you might find it painful, to re-generate .cs files after your .proto files are changed. And also make sure you could also right code logic around those .cs classes generated, without any hassle. I kind, came up with a solution to this for my cases. Sharing here, in case anyone else finds it useful.

The Solution

Lets create our solution first. My solution name is ProtobufDemo. I will add few projects (will describe later), and it looks like this –

This is a very simple solution –

  • src contains all the source code
    • ProtobufDemo.Message we will have .proto definition files here. I am a bit lazy and I really don’t going into command line and run a command each time I am modifying something in my definition file. I will use this project to auto generate the cs files from proto file.
    • ProtobufDemo.Message.Generated is the project we will have our generated POCO classes and also any additional logic that we might want to have for the message. For example, validation and adding some on demand fields, etc.

The Example Domain (.proto)

Our domain is a plain and simple blog entry. With 3 fields –

  • Title
  • Content
  • Author

So, it looks like this –

//Blog.proto

syntax = "proto3";
option csharp_namespace = "ProtobufDemo.Message"; // the generated namespace for cs classes

message Blog {
	string title = 1;
	string content = 2;
	string author = 3;
}

The Generated Domain (.cs)

Before we include the tools to generate the .cs classes, we need to fix few things. I have listed them bellow –

  1. I am going to use official grpc.tools to generate the .cs files. More about the grpc tools can be found here https://grpc.io/docs/quickstart/csharp/
  2. By default grpc.tools generates the files inside obj folder in the same project. This causes sometimes troubles for MSbuild system as something the build remnants stays there and causes double reference error.
  3. I am going to use the second project (ProtobufDemo.Message.Generated) to include those generated .cs files. This keeps both the projects and build system clean.

Add Required Tools

Lets add required nuget packages to our project, that will generate the .cs files from .proto files.

Go to project ProfibufDemo.Messages

Add packages –

<package id="Google.Protobuf" version="3.7.0" targetFramework="net47" />
  <package id="Grpc" version="1.20.1" targetFramework="net47" />
  <package id="Grpc.Core" version="1.20.1" targetFramework="net47" />
  <package id="Grpc.Core.Api" version="1.20.1" targetFramework="net47" />
  <package id="Grpc.Tools" version="1.20.1" targetFramework="net47" developmentDependency="true" />
  <package id="protobuf-net" version="2.4.0" targetFramework="net47" />
  <package id="System.Interactive.Async" version="3.2.0" targetFramework="net47" />

That will make sure every time we build project, it will convert any .proto file in this project to .cs .

Now, we need to control how that .cs file is being generated. As I mentioned earlier the default location is obj folder, which is not quite I want.

First, make sure the Build Action for your file is Protobuf. This option only appears after the nuget packages are installed.

You might need to reload the solution to have it enabled after installing the nuget package.

Modify Project file

Unfortunately, there is no shortcut for this. You have to modify the project file for ProtobufDemo.Message project to make sure the files are generated into correct locations. Since I am using the other project (ProfotbufDemo.Message.Generated) for including the .cs file, I will use the location for that project. Please use location that best suites your need.

<?xml version="1.0" encoding="utf-8"?>

 ....
  <ItemGroup>
    <None Include="packages.config" />
    <Protobuf Include="Protos\Blog.proto" CompilesOutput="False" GrpcServices="None" OutputDir="..\ProtobufDemo.Message.Generated\Generated" />
.....

That is right, just the item for the .proto file in this case –

<Protobuf Include="Protos\Blog.proto">

With –

<Protobuf Include="Protos\Blog.proto" CompilesOutput="False" GrpcServices="None" OutputDir="..\ProtobufDemo.Message.Generated\Generated" />

The Protobuf tag supports few more attributes. You can check them all out at grpc tools. https://grpc.io/docs/quickstart/csharp/

This practically says to generate the file to that location. Unfortunately, there is no shortcut to this, but luckily you only have to it once per file.

Now, build and you will see files generated in proper location.

Enable Show All Files from solution explorer, you will be able to see the generated folder/files. Lets include the file into the project –

That is it. Now every time you modify your .proto file, you will have your .cs auto generated and updated. No more extra works or commands to run.

Adding Custom Property to Generated POCO

Well, that solves half the problem. The other half is what if I Want to add some custom logic for the class or some custom validation or some custom read-only property to keep a clean implementation.

You are lucky, cause the POCO classes generated by grpc tools are partial. All you have to do is match the namepace and classname and you can have a very simple interface implementation and logic to inject with. I will not go into details, but a typical web framework with command handlers and controllers look like this –

The proto

syntax = "proto3";
option csharp_namespace = "ProtobufDemo.Message"; //match it in partial class

message Blog {
	string title = 1;
	string content = 2;
	string author = 3;
}

The Interface

namespace ProtobufDemo.Message
{
	public interface IDomain
	{
		bool HasTitle();
	}
}

The Custom Class


namespace ProtobufDemo.Message
{
	public partial class Blog : IDomain
	{
		public bool HasTitle()
		{
			return string.IsNullOrWhiteSpace(Title); //perfect use of shared property in partial class
		}
	}
}

The structure might look like this-

I hope this helps to keep things simple.


Monday, January 10, 2022

Adding custom monitors to zabbix

 Copied from 

https://programmer.ink/think/adding-custom-monitors-to-zabbix.html

Adding custom monitors to zabbix

Posted by lawnninja on Thu, 29 Aug 2019 14:14:58 +0200

Adding custom monitors to zabbix

By writing scripts to obtain various states of tcp, adding TCP status template, triggers, graphics, the whole process of customizing monitoring through scripts is realized.

1. agent-side configuration

1. Create custom scripts to store directories

[root@localhost ~]# mkdir /etc/zabbix/scripts
[root@localhost ~]# chown zabbix.zabbix /etc/zabbix/scripts/

2. Create scripts

Create a script to get the tcp status, as shown below

#!/bin/bash
#this script is used to get tcp and udp connetion status
#tcp status
metric=$1
tmp_file=/tmp/tcp_status.txt
/bin/netstat -an|awk '/^tcp/{++S[$NF]}END{for(a in S) print a,S[a]}' > $tmp_file

case $metric in
  closed)
         output=$(awk '/CLOSED/{print $2}' $tmp_file)
         if [ "$output" == "" ];then
            echo 0
         else
            echo $output
         fi
       ;;
  listen)
         output=$(awk '/LISTEN/{print $2}' $tmp_file)
         if [ "$output" == "" ];then
            echo 0
         else
            echo $output
         fi
       ;;
  synrecv)
         output=$(awk '/SYN_RECV/{print $2}' $tmp_file)
         if [ "$output" == "" ];then
            echo 0
         else
            echo $output
         fi
       ;;
  synsent)
         output=$(awk '/SYN_SENT/{print $2}' $tmp_file)
         if [ "$output" == "" ];then
            echo 0
         else
            echo $output
         fi
       ;;
  established)
         output=$(awk '/ESTABLISHED/{print $2}' $tmp_file)
         if [ "$output" == "" ];then
            echo 0
         else
            echo $output
         fi
       ;;
  timewait)
         output=$(awk '/TIME_WAIT/{print $2}' $tmp_file)
         if [ "$output" == "" ];then
            echo 0
         else
            echo $output
         fi
       ;;
  closing)
         output=$(awk '/CLOSING/{print $2}' $tmp_file)
         if [ "$output" == "" ];then
            echo 0
         else
            echo $output
         fi
       ;;
  closewait)
         output=$(awk '/CLOSE_WAIT/{print $2}' $tmp_file)
         if [ "$output" == "" ];then
            echo 0
         else
            echo $output
         fi
       ;;
  lastack)
         output=$(awk '/LAST_ACK/{print $2}' $tmp_file)
         if [ "$output" == "" ];then
            echo 0
         else
            echo $output
         fi
        ;;
  finwait1)
         output=$(awk '/FIN_WAIT1/{print $2}' $tmp_file)
         if [ "$output" == "" ];then
            echo 0
         else
            echo $output
         fi
        ;;
  finwait2)
         output=$(awk '/FIN_WAIT2/{print $2}' $tmp_file)
         if [ "$output" == "" ];then
            echo 0
         else
            echo $output
         fi
        ;;
        *)
         echo -e "\e[033mUsage: sh  $0 [closed|closing|closewait|synrecv|synsent|finwait1|finwait2|listen|established|lastack|timewait]\e[0m"
esac

3. Configure zabbix_agent d.conf

To execute a custom script to get data, you need to open the appropriate options in the configuration file. If you have started, you can skip this step.

[root@localhost ~]# egrep -v "(^#|^$)" /etc/zabbix/zabbix_agentd.conf
PidFile=/var/run/zabbix/zabbix_agentd.pid
LogFile=/var/log/zabbix/zabbix_agentd.log
LogFileSize=1
EnableRemoteCommands=1  #Allow remote commands to be executed locally
Server=c2600217k6.wicp.vip
ListenPort=10050
ListenIP=0.0.0.0
StartAgents=3
Hostname=47.96.226.49
UnsafeUserParameters=1 #Enable user-defined monitoring scripts
Include=/etc/zabbix/zabbix_agentd.d/*.conf
Timeout=8

4. Custom key profile

[root@localhost ~]# cat /etc/zabbix/zabbix_agentd.d/tcp-status-params.conf 
UserParameter=tcp.status[*],/etc/zabbix/scripts/tcp_conn_status.sh $1

Note: The tcp.status here is the monitored item name, followed by $1 is the corresponding parameter.
For example, the state of closewait is tcp.status[closewait]

5. Restart service

[root@localhost ~]# systemctl restart zabbix-agent.service

6. Testing

Test whether you can get customized monitoring data by zabbix_get on the server side
[root@localhost ~]# zabbix_get -s ip -p 10050 -k "tcp.status[listen]"
13

[root@localhost ~]# zabbix_get -s ip -p 10050 -k "tcp.status[listen]"
13

No problem with data
Note: This command is executed on the server side of zabbix, not on the agent side.
If there is no zabbix_get command, install zabbix_get

[root@localhost ~]# yum -y install  zabbix-get
 Loaded plug-in: fastest mirror
Loading mirror speeds from cached hostfile
 * base: mirrors.aliyun.com
 * epel: mirrors.aliyun.com
 * extras: mirrors.aliyun.com
 * updates: mirrors.aliyun.com
 The package zabbix-get-4.0.12-1.el7.x86_64 is installed and is the latest version without any processing.

Defining custom templates

After the agent side configuration is completed, we need to create the corresponding template on the zabbix server web. Other hosts can apply the template to obtain custom data.

1. Creating Templates

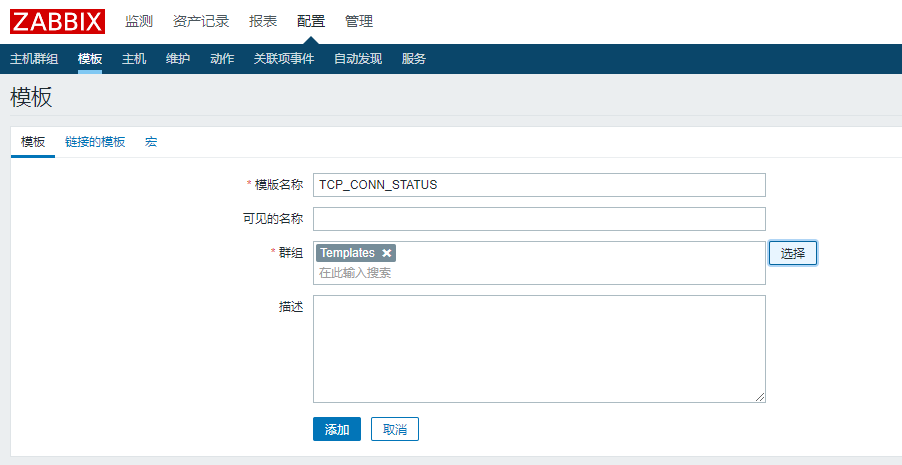
Create a new template in Configuration -> Template ->.
The template name "TCP_CONN_STATUS" group is placed in Templates, and the configuration is shown below.

2. Create monitoring items

After creating the template, we should create the application set first, but when creating the monitor item, we can create the application set directly, so we skip the creation of the application set.
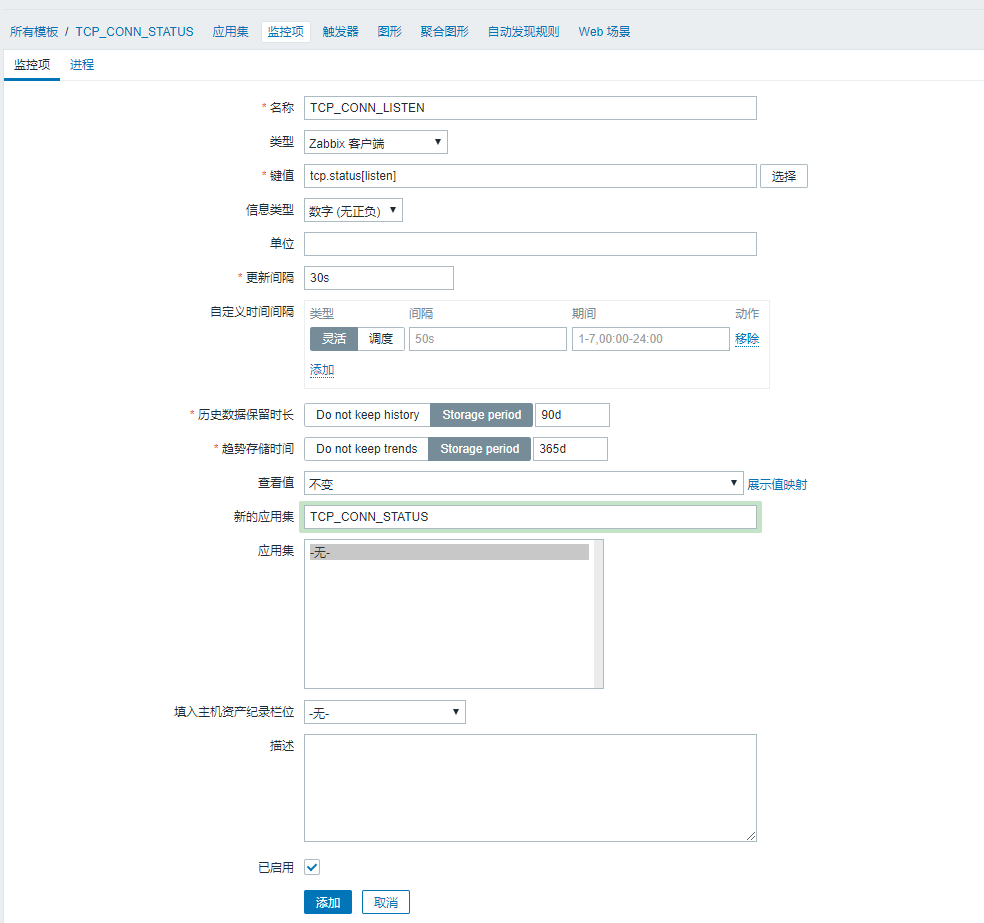
Find the newly created template in Configuration -> Template -> TCP_CONN_STATUS -> Monitor Item -> Create Monitor Item

In the monitor item, we define the name TCP_CONN_LISTEN to monitor the number of LISTENs in tcp. The key value is tcp.status[listen] defined in our custom key, and then select the new application set TCP_CONN_STATUS at the application set. Click Add, as shown in the following figure:

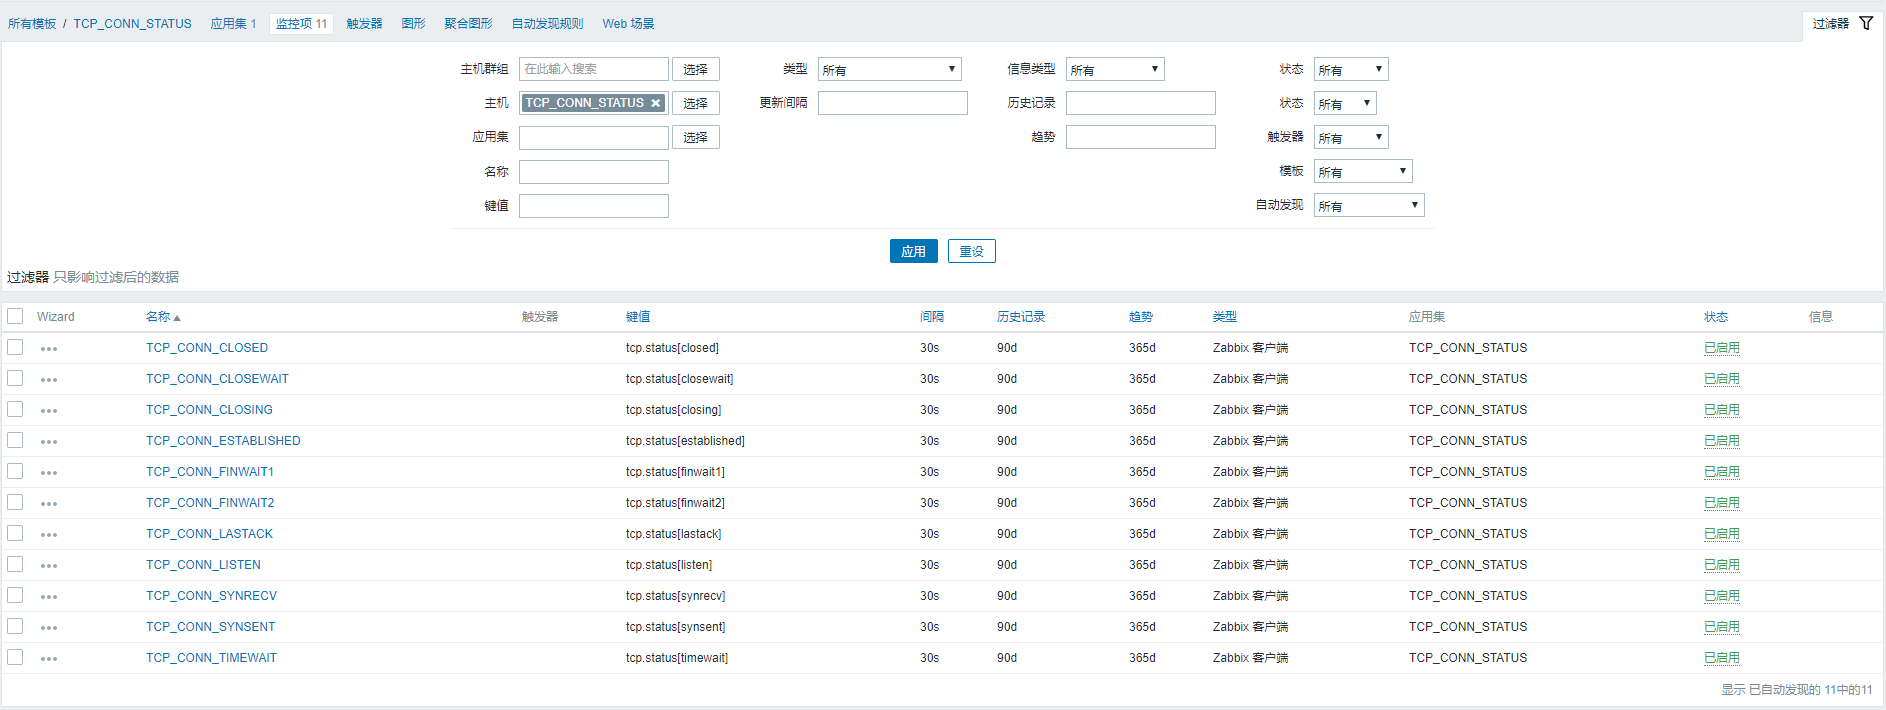
Create other tcp states such as TCP_CONN_CLOSED, TCP_CONN_FIN-WAIT-1, TCP_CONN_LAST-ACK, TCP_CONN_SYN-RECV, TCP_CONN_TIME-WAIT and so on by the above steps.
The final monitoring items are shown in the following figure:

3. Create triggers

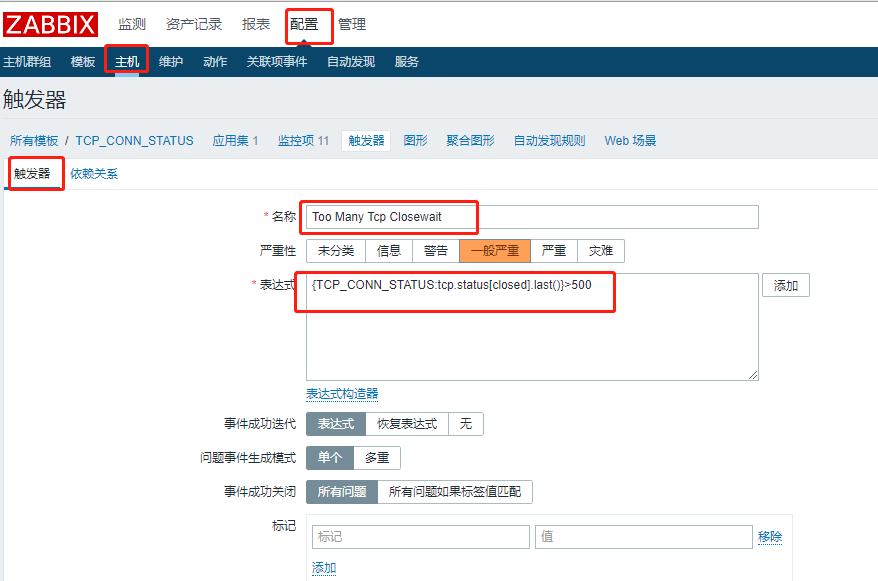
Find the newly created template in Configuration -> Template -> TCP_CONN_STATUS -> Trigger -> Create Trigger, as shown in the following figure:

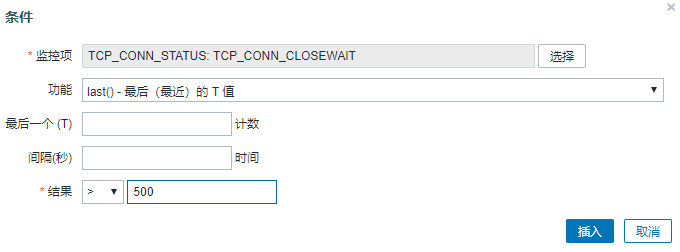
Create a trigger named Too Many Tcp Closewait, set the number of closewaits to alarm, I set it to 500, the expression is {TCP_CONN_STATUS: tcp. status [closed]. last ()}> 500, the specific configuration is as follows:

The expression is added at that point. In the monitor item, select the close wait monitor item and insert the result with > 500 clicks, as shown in the following figure:

4. Creating Graphics

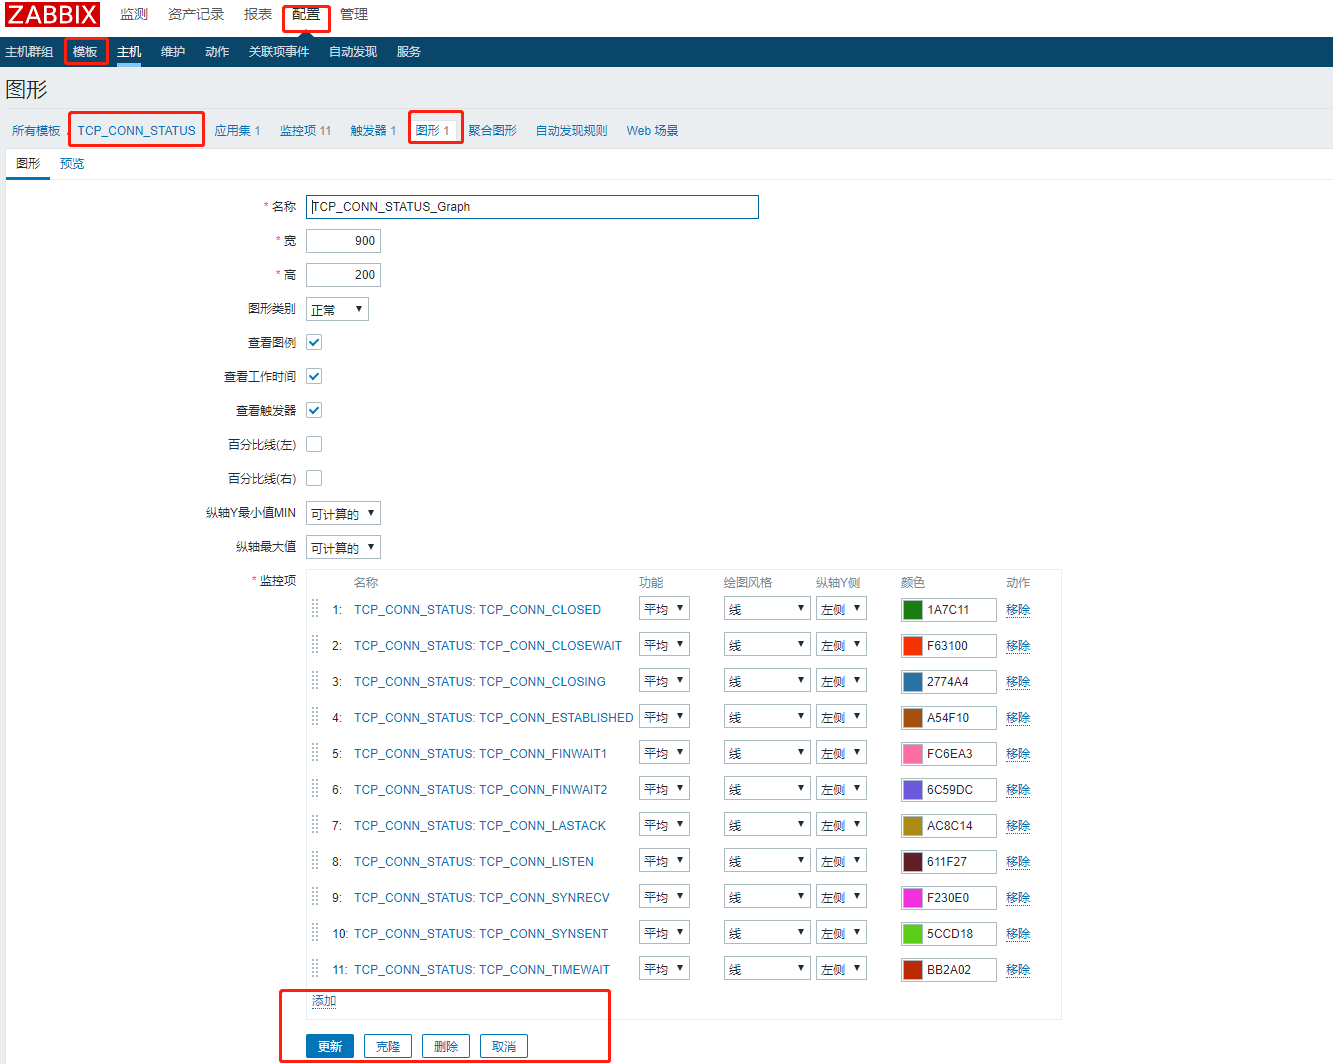
Configuration -> Module -> TCP_CONN_STATUS - > Graphics - > Create Graphics - > Name "TCP_CONN_STATUS_Graph" - > Select Pre-monitor - > Add as follows:

To complete a custom monitoring template definition here

5. Associated Host

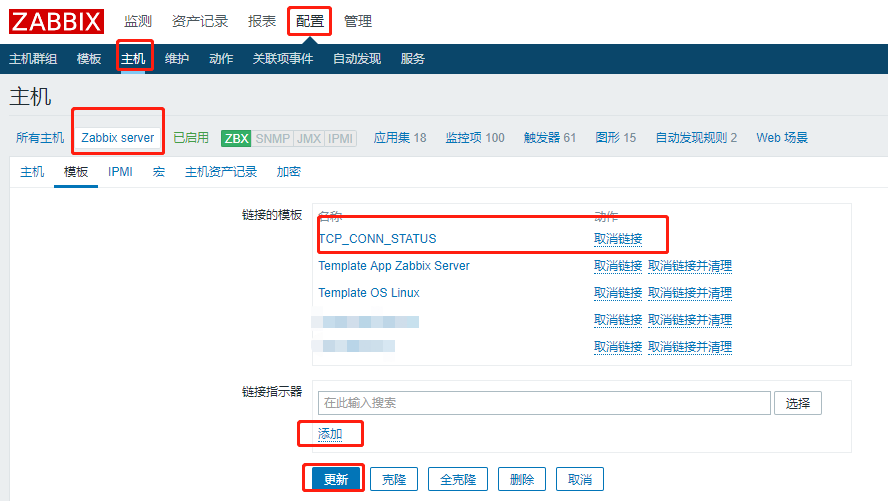
Connect the template we just created to our host for the template to take effect
In Configuration -> Host -> Select the Host to Monitor -> Click Template -> Select the Template we just created on the Link Indicator, click Add -> Click Update, and the Template is added, as shown in the following figure:

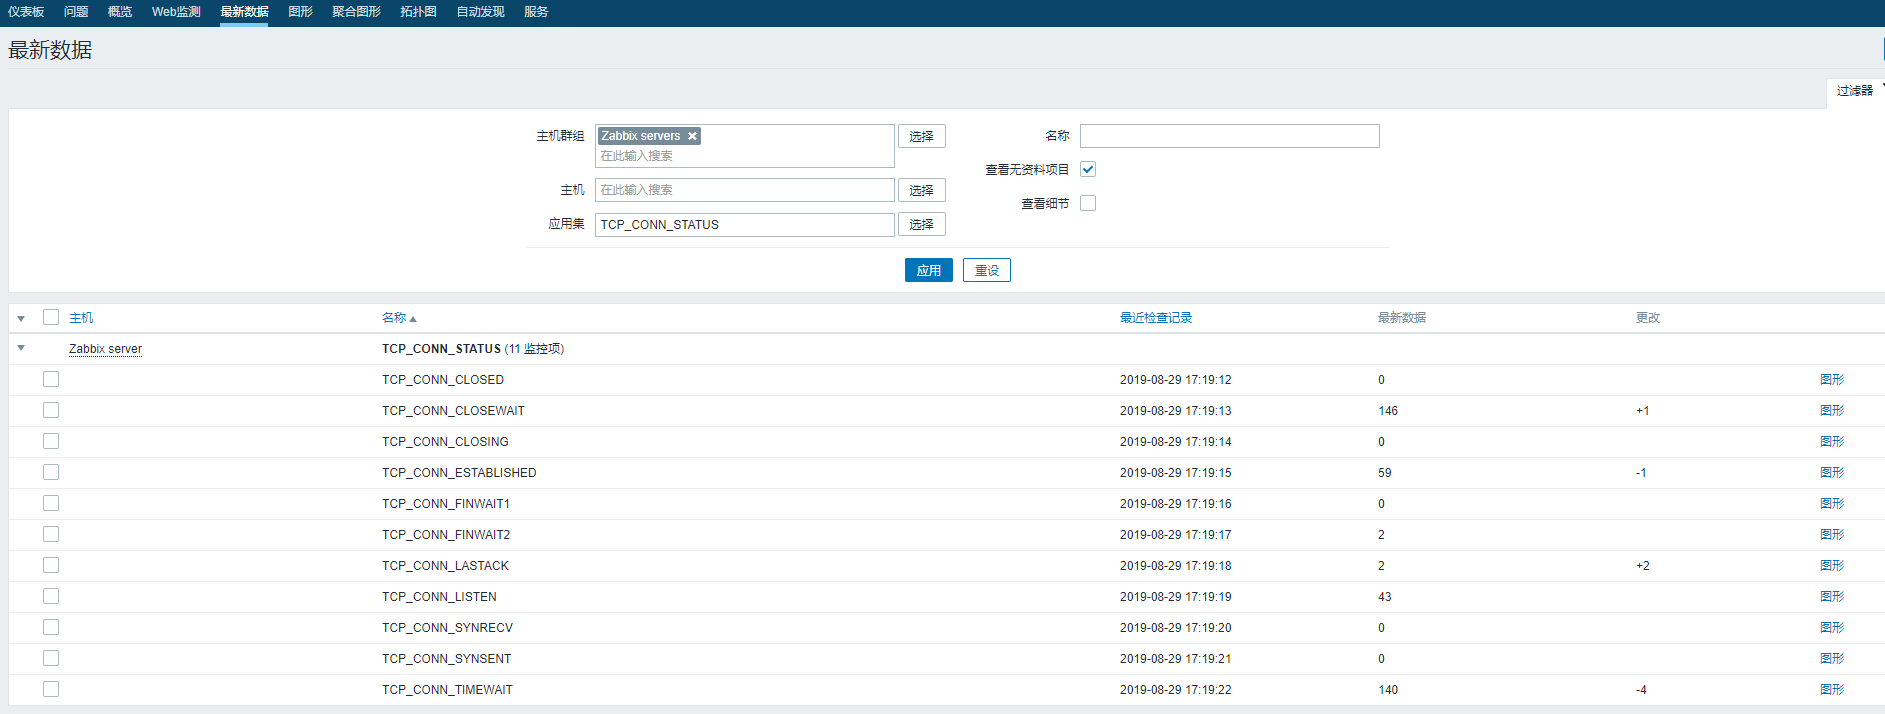
We can see the latest data generation in Detect -> Latest Data -> Select the host that just added the template -> Select the Application Set (TCP_CONN_STATUS), which shows that our template configuration is successful, as shown in the following figure:

You can also select TCP_CONN_STATUS_Graph we created earlier in the graph to see the graph generation, as shown in the following figure:

Little knowledge:
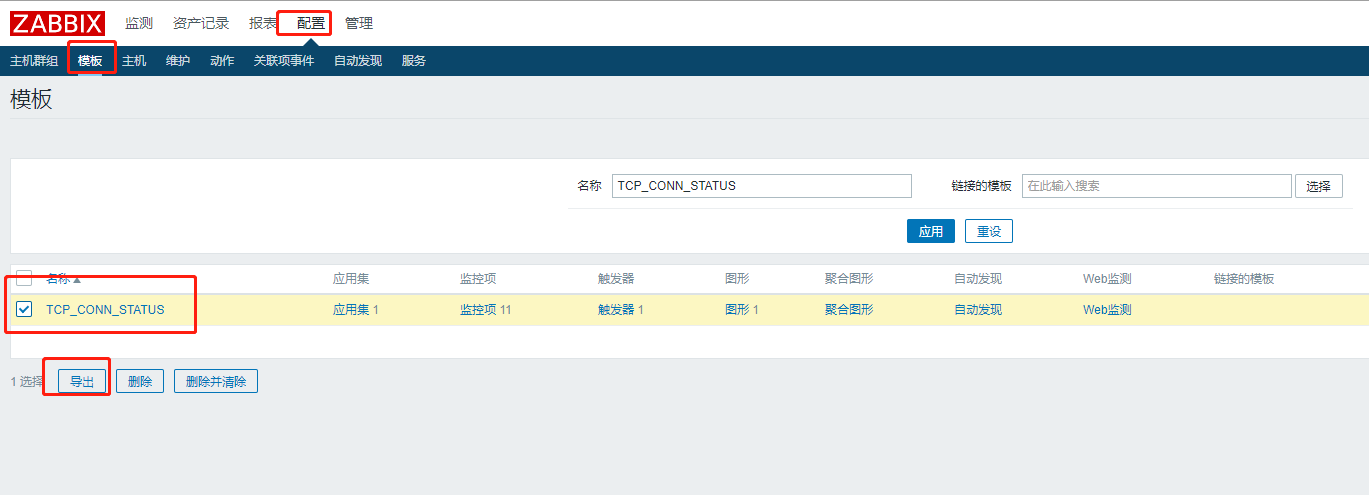
After we have created the template, we can choose to export the template to facilitate our sharing and reuse.
In Configuration -> Template -> Find the Template we created -> Check Template -> Click Export
Save the exported files and use them on other hosts. Note that the template and agent configurations should be consistent.

Topics: Zabbix yum EPEL